
SmartMet (SILAM)
Air pollution forecast maps for Tajikistan and neighbouring countries from the SILAM model. The Finnish Meteorological Institute (FMI) computes them every day under the FINTAJ project.
Thu, Nov 5, 05:00 AM Dushanbe time · 00Z on the map
Scroll the mouse wheel over the map: down for later, up for earlier. You can also pick an hour by hovering over the hour strip.Swipe the map left or right to change the hour.
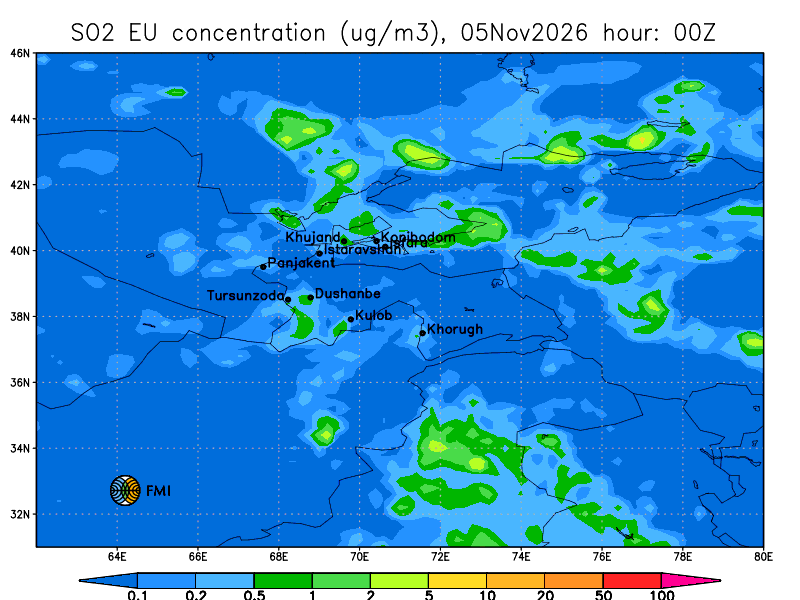
Sulphur dioxide. Near-surface concentration, µg/m³. Sources: burning of coal and fuel oil, industry.
© Finnish Meteorological Institute (FMI), SILAM model. FMI images are shown unchanged.Full-size frame
FMI run of November 4, 00 UTC; maps issued November 4 at 11:02 AM.
What these maps are
SILAM (System for Integrated modeLling of Atmospheric coMposition) is an atmospheric composition model developed by the Finnish Meteorological Institute. It computes how substances from traffic, industry, stoves, fires and dust storms are carried by wind, mixed, chemically transformed and deposited.
For Tajikistan, FMI computes a 48-hour forecast every day. The run usually starts at 00 UTC of the previous day, so it takes in information on actual emissions over the past day. New maps appear at about 07:00 Dushanbe time and cover the period up to 05:00 the next day.
The model shows background pollution over a large area with a grid of tens of kilometres. It is a calculation, not a measurement: next to a busy street or a plant the air may be worse. For measured data, see the monitoring stations page.
How to read the map
- Choose a parameter with the buttons above the map. Change the time with the mouse wheel over the map (down for later, up for earlier) or by hovering over the hour strip; on a phone, swipe the map left or right; on a keyboard, use the arrow keys. “Animate” plays all 48 hours; frames load one at a time, so on a slow connection the animation runs slower.
- The map title gives the time in UTC: “hour: 06Z” means 06:00 UTC, or 11:00 in Dushanbe. Above the map the portal shows local time.
- Colour shows the near-surface concentration in micrograms per cubic metre (µg/m³); the scale is below the map. The scale is uneven: each step is roughly twice the previous one, so neighbouring colours differ several-fold.
- AQI is the five-level FMI air quality index: the colour at each point is the worst of the pollutant levels. Legend labels are in English; the table below matches them to the portal's levels.
- ABL is the height of the atmospheric boundary layer in metres. At night and in winter, especially during inversions in valleys, the layer drops to a few tens of metres: emissions hardly disperse and pollution builds up near the ground.
- Dots are towns of Tajikistan (Dushanbe, Khujand, Kulob, Khorugh and others), lines are national borders, the edges show latitude and longitude.
AQI levels on FMI maps
The FMI index is based on hourly concentrations: at each point the level is set by the pollutant with the worst sub-index. Thresholds, µg/m³:
| Level | FMI legend | SO₂ | NO₂ | PM10 | PM2.5 | O₃ |
|---|---|---|---|---|---|---|
| Good | Good | < 20 | < 40 | < 20 | < 10 | < 60 |
| Satisfactory | Fair | 20–80 | 40–70 | 20–50 | 10–25 | 60–100 |
| Fair | Moderate | 80–250 | 70–150 | 50–100 | 25–50 | 100–140 |
| Poor | Poor | 250–350 | 150–200 | 100–200 | 50–75 | 140–180 |
| Very poor | VeryPoor | > 350 | > 200 | > 200 | > 75 | > 180 |
By default the portal's operational scale uses the same thresholds (modelled on the FMI/HSY index) - more about the index. Thresholds: FMI air quality index.
SILAM elsewhere on the portal
The map has a SILAM layer from FMI's global model with a grid of about 20 km, 5 days ahead, in the portal's scale colours; you can zoom in and view it together with stations.
Station pages and city weather forecasts show a daily SILAM forecast for that place.
Source and limitations
The maps are computed and published by FMI at silam.fmi.fi under the FINTAJ project; the portal shows them unchanged and updates them after FMI does.
FMI notes that model products are created for scientific use and their accuracy and completeness are not guaranteed. The official air quality assessment is based on the Agency's monitoring stations; hazardous phenomena are in the Warnings section.